Pollen pollution finally visible!
Let's act for a quieter lifePollen exposure finally visible!
Let's act for a quieter life.
1 in 4 people
is affected by respiratory allergies.
<p><strong style=”font-size: 32px;”>130 billion euros</strong> spent on treatments for chronic allergies in Europe.</p>
4th
rank worldwide for chronic diseases.
Reducing exposure,
but why?
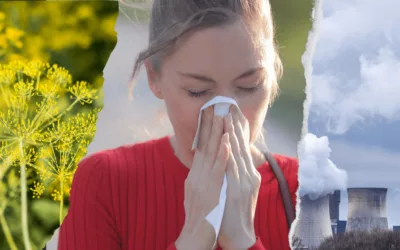
Pollen allergies are one of the main causes of chronic illness. Depending on the seasons and regions, the types of pollen vary, resulting in variable allergenicity. Climate change leads to increasingly long and intense pollen seasons, and pollution can exacerbate pollen reactions.
The sources of pollen are plants and trees. The taxa found vary according to seasons and regions. Pollen grains can attach to fine particles of different natures, and a pollen grain can itself be considered a fine particle. The diameter of pollen varies by species.
Turn environmental data into action:
Understand the impact of pollen to anticipate
and promote healthier decisions.

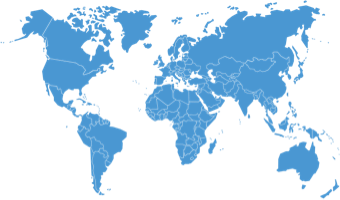
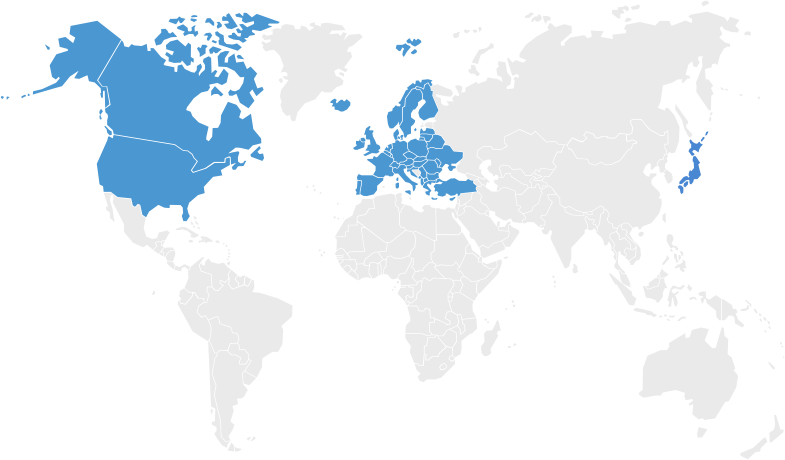
Coverage of Europe, North America & Japan
64 countries currently covered by pollen modeling. Constantly expanding geographical coverage.
High precision
The solution offers highly accurate measurements, which are essential for ensuring reliable environmental data that can be used for decision-making.
Available in different timeframes
Access data over different time horizons, whether current, forecast (96 hours) or historical (3 years). It’s also possible to predict pollen episodes, enabling you to adapt preventive actions and set up alerts to better anticipate risks.
Multi-species
25 different pollen species processed and divided into different pollen typologies: grasses, trees and weeds.
Plug & Play
The solution is easy to install and use. It’s ready to use, with no need for complex configuration.
Customized to your needs
Meersens models pollen distribution by combining satellite imagery with exclusive models to predict and forecast pollen levels from trees, grasses, and weeds. The models are based on weather conditions (precipitation, humidity, temperature) and on seasonality, which depends on the pollen species and location. This data is also combined with high-resolution vegetation distribution data to accurately assess pollen presence at a city-wide scale and to better prevent allergy risks. Since vegetation is heavily influenced by the modeled geographic area, the models are location-based, and Meersens produces very comprehensive inventories of the plant species involved in each area.
A question, a project
Customizable information for every business sector

🏙️ Smart Cities
Ensuring public health and well-being.
Seasonal allergies can impact the productivity, well-being, and health of city residents. To address this issue, cities are integrating pollen monitoring data into their urban management systems, allowing them to anticipate pollen peaks and take proactive measures. This information is valuable for alerting allergic residents through mobile apps or display boards, enabling them to plan their activities accordingly and limit their exposure to allergens. This approach enhances the city’s image as a committed player in environmental preservation and the promotion of public health.

🛡️ Insurance Companies
Adapting offers.
Individuals suffering from seasonal allergies can experience adverse effects on their health and quality of life due to exposure to pollen. Insurance companies use pollen monitoring data to assess the risks associated with seasonal allergies in different regions. This allows them to better tailor their health insurance offers and provide prevention and management services for allergies, such as awareness programs and personalized advice.

💊 Pharmaceutical Industries
R&D: guiding research efforts.
Pharmaceutical companies develop medications and treatments to relieve symptoms associated with seasonal allergies. By using pollen monitoring data, they can identify regions with the highest levels of allergenic pollen. This information helps guide their research and development efforts towards treatments that best meet the specific needs of the affected populations and can be used to support public awareness campaigns on available treatment options.
Explore our data catalog The Meersens API platform manages over 150 pollutants and parameters, providing you with new ways to achieve your goals and improve your operations.
Explore Air Quality Data >
Explore Pollen Data >
Explore Noise Pollution Data >
Explore Tap Water Quality Data >
Explore UV Data >
Explore Weather Data >
• Particulate matter PM2.5
• Particulate matter PM10
• Ozone O3
• Sulphur dioxide SO2
• Carbon monoxide CO
• Grasses
• Weeds
• Grasses
• Weeds
• Levening: average evening noise between 6 PM and 10 PM
• Lnight: average night noise between 10 PM and 6 AM
• LDEN: average daily noise
• Railway noise
• Aerial noise
• Chemical
• Microbiological
• Global Horizontal Irradiance
• Relative humidity
• Atmospheric pressure
• Wind speed & direction
• Precipitation
• Cloud cover
Pollen news

Webinaire : environnement et santé mentale
Environnement et santé mentale : comprendre pour agir La santé mentale est aujourd’hui au cœur des enjeux de santé publique. Stress, anxiété, fatigue mentale ou troubles du sommeil touchent une part croissante de la population. Pourtant, ces problématiques sont encore...

Pollen allergy cost: how pollen data revolutionize healthcare systems
Often underestimated, pollen has a significant impact on our health and represents a considerable economic cost for global healthcare systems.
Pollen: Climate change, a factor increasing allergies
Pollen and climate change: a significant impact on the quantity and allergenic potential of pollen.
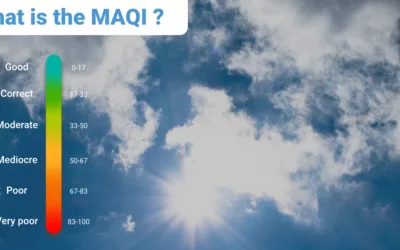
The MAQI: global air quality and health index for all
The MAQI: the first global air quality index taking into account the impact of environment and health.


