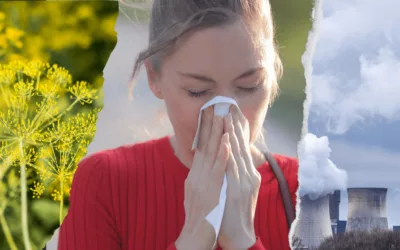
The pollution of the AIR finally visible!
Let's act for a healthier AirThe pollution of the AIR finally visible!
Let's act for a healthier Air9 out of 10 people
9 out of 10 people breathe polluted air worldwide. WHO
12,000
liters of air inhaled per day on average by each person, without knowing its quality or composition.
5 to 7 times more polluted
Indoor air is more polluted than outdoor air and is among the top 5 environmental risks to public health.
US EPA Agency
Reducing exposure,
but why?
Air pollution is a threat to health and the environment; it is the leading harmful environmental factor and is associated with 7 million premature deaths each year.
Short- and long-term exposure to air pollution can affect all organs and lead to various diseases or exacerbate pre-existing conditions.
Adults as well as children are affected; more than 90% of children worldwide breathe polluted air every day. Cleaner air could have saved 178,000 lives across the EU in 2019.
Making air quality visible is necessary to improve health and take meaningful action.
Turn environmental data into action:
Understand the impact of air pollution to anticipate
and promote healthier decisions.

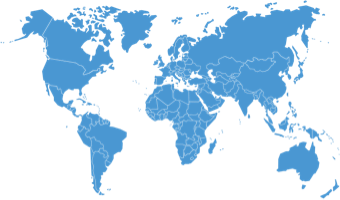
Worldwide coverage
Access air quality data from anywhere in the world. Our solution provides up-to-date information for millions of points around the globe, guaranteeing reliable international coverage.
High data accuracy
Accurate, verified data for in-depth air quality analysis. Our models and algorithms are based on reference data sources to guarantee optimum accuracy for the detection of pollutants and air quality indicators.
Real-time, historical and forecast data
Monitor air quality with real-time data updates, consult historical pollution levels to better understand trends, and anticipate future variations with our forecasts based on advanced models. A complete view to make the best decisions.
Multi-pollutants
Main pollutants available: fine particles (PM2.5 / PM10), ozone (O3), nitrogen dioxide (NO2), sulfur dioxide (SO2), carbon monoxide (CO).
Measuring up to standards
Compare current pollution levels to the regulatory thresholds* set by local and international authorities. Our indicators allow you to see if the air quality meets the environmental standards in your area.
*ATMO, European, American, Canadian, Chinese, Meersens,…
Plug&Play
Install and use our solutions with ease. Set-up is quick and intuitive, with no need for technical expertise. Get instant access to air quality data for immediate analysis.
Customized to your needs
Tailor our solutions to your specific needs. Whether you’re a company or a local authority, we offer tailor-made analyses and recommendations to protect health and improve quality of life.
Air quality modeling is carried out using Meersens’ proprietary models. These statistical models can predict pollutant concentrations anywhere in the world, on an hourly basis, with a street-level resolution.
The models are trained with two inputs: a network of over 10,000 ground monitoring stations distributed worldwide and satellite images to obtain background pollution levels. Combined with contextual data (topography, roads and traffic, population density, land use, etc.), this allows for a revolutionary modeling of pollutants, providing you with accurate, reliable, and hyperlocal information on air quality.
93.7%
Average accuracy of air quality models.
Accuracy is calculated hourly by comparing modeling results to approximately 10,000 ground monitoring stations in terms of American AQI classes.
+220K
Number of evaluations of our models.
The accuracy of air quality models is evaluated multiple times each day.
Sensors
Monitor indoor air pollution.
On average, we spend 80 to 90% of our time indoors, where the air is 5 to 7 times more polluted than outside. This is due to numerous factors and pollutants that can impact health.
Business leaders have a regulatory obligation to ensure indoor air quality, not only to comply with Corporate Social Responsibility (CSR) policies but also to optimize the work environment and improve Quality of Life at Work (QWL). By doing so, they can enhance cognitive abilities and reduce absenteeism rates.
CO
Carbon monoxide
COV
Volatile organic compounds
CO2
Carbon dioxide
PM
Fine particles

Sensors
Monitor indoor air pollution.
We spend an average of 80 to 90% of our time in enclosed spaces, where the air is 5 to 7 times more polluted than outdoor air. Many factors and pollutants contribute to this, which can have impacts on health.
Business leaders have a regulatory obligation to ensure indoor air quality, not only to comply with Corporate Social Responsibility (CSR) policies but also to optimize the work environment and improve Quality of Life at Work (QWL). By doing so, they can enhance cognitive abilities and reduce absenteeism.
CO
Carbon monoxide
COV
Volatile organic compounds
CO2
Carbon dioxide
PM
Fine particles
Meersens Air Quality Index (MAQI)
The air quality index represents an overall air quality based on pollutant concentration. However, different countries have various air quality indices linked to different pollutant concentrations. Thus, depending on the country and the reference period, the health risk and air quality index change.
In this context, Meersens has decided to develop a new index, the MAQI (Meersens Air Quality Index), combining its current and historical indices to simplify them for better public understanding. The index is based on pollutant concentrations according to WHO standards and those of countries around the world, depending on the duration of exposure. In this new air quality index, the health risk of a given concentration indicates the time a person can remain exposed to pollutants before there is a health risk. This remains relevant compared to other indices as it allows for a better understanding of risks and formulating recommendations to prevent risks related to exposure to poor air quality.

Customizable information for every business sector

❄️ HVAC (Heating, Ventilation, and Air Conditioning) Systems
Optimize the performance and energy efficiency of heating, ventilation, and air conditioning systems.
Real estate companies are looking to improve the air quality of their buildings while reducing energy costs.
By integrating real-time data on indoor and outdoor air quality into HVAC systems, they automatically adjust parameters based on pollutant levels and weather conditions. This improves the quality of life for occupants while optimizing costs. This approach adds value to HVAC systems by making them more efficient and tailored to the specific needs of the buildings.

🏢 CSR Companies
Ensure a healthy and productive work environment.
A company aims to guarantee the health and well-being of its employees by monitoring indoor air quality. Air quality sensors are installed in offices, meeting rooms, workspaces, and production areas. These sensors monitor levels of carbon dioxide (CO2), volatile organic compounds (VOCs), carbon monoxide (CO), fine particles (PM), humidity, and temperature.
By monitoring and maintaining good indoor air quality, the company can reduce health risks for employees, increase their productivity, and decrease absenteeism related to respiratory issues and illnesses linked to poor air quality.

🏙️ Smart Cities
Ensure public health and well-being.
A city wants to monitor air quality in real-time across its various neighborhoods to comply with air quality regulations and take preventive measures against air pollution.
To achieve this, it is considering two approaches: modeling in a specific area or deploying air quality sensors in strategic locations such as intersections, industrial zones, and parks. By collecting data on levels of fine particles, nitrogen dioxide, sulfur dioxide, and other air pollutants, the city can implement more effective policies and regulations to reduce pollution, protect public health, and improve the quality of life for its residents.
The Meersens API platform manages over 150 pollutants and parameters, providing you with new ways to achieve your goals and enhance your operations.
Explore Air Quality Data >
Explore Pollen Data >
Explore Noise Pollution Data >
Explore Tap Water Quality Data >
Explore UV Data >
Explore Weather Data >
• Particulate matter PM2.5
• Particulate matter PM10
• Ozone O3
• Sulphur dioxide SO2
• Carbon monoxide CO
• Grasses
• Weeds
• Grasses
• Weeds
• Levening: average evening noise between 6 PM and 10 PM
• Lnight: average night noise between 10 PM and 6 AM
• LDEN: average daily noise
• Railway noise
• Aerial noise
• Chemical
• Microbiological
• Global Horizontal Irradiance
• Relative humidity
• Atmospheric pressure
• Wind speed & direction
• Precipitation
• Cloud cover
Air pollution news

Webinaire : environnement et santé mentale
Environnement et santé mentale : comprendre pour agir La santé mentale est aujourd’hui au cœur des enjeux de santé publique. Stress, anxiété, fatigue mentale ou troubles du sommeil touchent une part croissante de la population. Pourtant, ces problématiques sont encore...

Qualité de l’air en France 2023 : des émissions en baisse, mais des défis à relever
Qualité de l’air en France 2023 : des émissions en baisse, mais des défis à relever La qualité de l’air est un enjeu majeur de santé publique et de bien-être, et à l’occasion de la Journée nationale de la qualité de l’air (JNQA) le 14 octobre, un bilan très attendu...

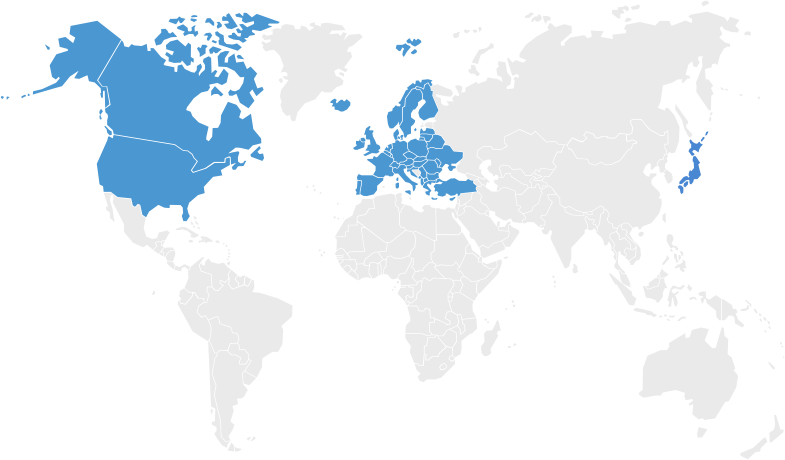
PM2.5 concentrations: only 7 countries meet WHO standards
According to a recent study, only 7 out of 134 countries examined meet the standards set by the WHO for fine particulate matter.
Pollen: Climate change, a factor increasing allergies
Pollen and climate change: a significant impact on the quantity and allergenic potential of pollen.


