UV exposure finally visible!
Let's act for a quieter lifeskin cancers per year in France, of which more than 2/3 are linked to excessive sun exposure. FRM
The risks associated with exposure are not related to the feeling of heat but to the intensity of UV rays. Beware of false impressions, especially when it’s cool and the sky is cloudy.
Reckless sun exposure before the age of 20 significantly increases the risk of skin cancer.

Reduce your exposure,
but why?
The sun brings us a sense of well-being, it regulates our internal clock, and allows for the synthesis of vitamin D, but overexposure presents irreversible damage, and in the most severe cases, can be fatal.
Sun exposure poses risks to the skin, causing sunburn, premature aging, allergies, and is also responsible for cancers—melanomas and carcinomas. Exposure also presents risks to the eyes, where serious conditions can arise, such as cataracts and retinal degenerations.
Turn environmental data into action:
Understand the impact of UV to anticipate
and promote healthier decisions.

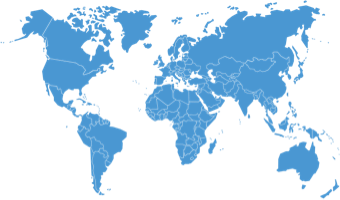
Worldwide coverage
Enjoy comprehensive UV coverage worldwide. Wherever you are, Meersens provides you with real-time data on UV exposure levels to protect you effectively, whatever your location.
High precision
Benefit from ultra-precise data and anticipate the risks associated with sun exposure with reliable, accurate information.
Available in different timeframes
Access data according to different timeframes: current, forecast (96 hours) or historical (3 years).
Plug & Play
Easily integrate our solution into your systems. No complex configuration is required, so you can deploy our UV services quickly and efficiently.
Customized to your needs
Tailor UV data to your specific needs. Whether you’re in the healthcare, wellness or smart city sectors, Meersens customizes data to meet your business requirements.
Meersens makes the UV index available worldwide through post-processing of satellite imagery. Our platform combines satellite imagery from leaders in space technology with weather modeling to provide a precise and realistic UV index at the Earth’s surface, taking cloud cover into account. This ensures that the retrieved information is truly applicable to the populations for which Meersens’ clients are responsible. The UV index is available on an hourly basis, with long-term forecasting capabilities to anticipate UV peaks. The temporal data also allows for long-term decision-making, considering the seasonality of this very specific data source.
Total sky UV index
The Meersens platform provides the total sky UV index, meaning that the UV data accounts for the UV index at the Earth’s surface, taking cloud cover into consideration.
92%
Median correlation coefficient of the UV index compared to surface UV measurements.
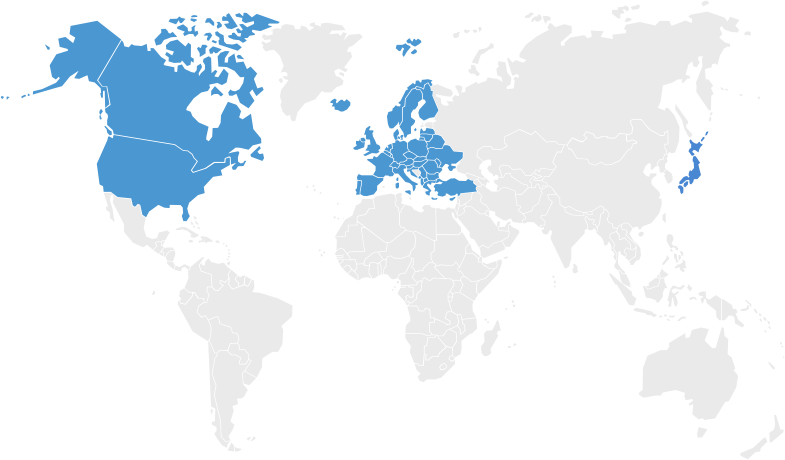
Calculated quarterly from over 40 monitoring stations based in Europe, Israel, Thailand, Australia, and Antarctica.
A question, a project?
Customizable information for every business sector

📱 Health & Wellness App
Informing and raising awareness among users.
Fitness and physical activity tracking applications, equipped with GPS features to monitor user performance during outdoor activities, can integrate UV data to provide additional information about weather conditions. By using this data, the app can alert users to current and forecasted UV levels during their activities, encouraging them to take appropriate measures to protect themselves from the sun. Furthermore, it helps raise users’ awareness of the importance of sun protection during their outdoor sports activities.

🧴 Cosmétiques & soins de la peau
Améliorer l’expérience client.
L’exposition aux UV, notammment en fonction du phototype de peau, entraîne un vieillissement prématuré et peut être à l’origine de cancers.
Les informations sur les rayons UV peuvent enrichir l’expérience client en proposant des recommandations de soins personnalisées. En évaluant l’effet des UV sur la peau, vous pouvez conseiller à vos clients des routines adaptées à leur environnement local, tout en les informant des meilleures pratiques en matière de beauté. Cette expérience peut être concrétisée à travers divers outils tels qu’une application web, une application mobile ou un widget intégré au site internet.

🏙️ Smart Cities
Ensuring public health and well-being.
Explore our data catalog
The Meersens API platform manages over 150 pollutants and parameters, providing you with new ways to achieve your goals and enhance your operations.
Explore Air Quality Data >
Explore Pollen Data >
Explore Noise Pollution Data >
Explore Tap Water Quality Data >
Explore UV Data >
Explore Weather Data >
• Particulate matter PM2.5
• Particulate matter PM10
• Ozone O3
• Sulphur dioxide SO2
• Carbon monoxide CO
• Grasses
• Weeds
• Grasses
• Weeds
• Levening: average evening noise between 6 PM and 10 PM
• Lnight: average night noise between 10 PM and 6 AM
• LDEN: average daily noise
• Railway noise
• Aerial noise
• Chemical
• Microbiological
• Global Horizontal Irradiance
• Relative humidity
• Atmospheric pressure
• Wind speed & direction
• Precipitation
• Cloud cover
News on UV radiation

Webinaire : environnement et santé mentale
Environnement et santé mentale : comprendre pour agir La santé mentale est aujourd’hui au cœur des enjeux de santé publique. Stress, anxiété, fatigue mentale ou troubles du sommeil touchent une part croissante de la population. Pourtant, ces problématiques sont encore...
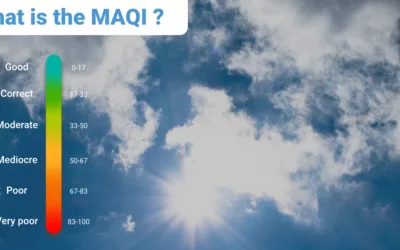
The MAQI: global air quality and health index for all
The MAQI: the first global air quality index taking into account the impact of environment and health.

Artificial tanning: what dangers for the skin and health?
Artificial tanning: Exposing your skin to artificial UV at least once in your life increases the risk of cutaneous melanoma by 15%.
Sun and permanent hair removal: what you need to know
The sun represents the main contraindication for permanent hair removal. It is important to avoid UV rays before and after a session


