NOISE POLLUTION finally visible!
Let's act for a quieter life.
NOISE POLLUTION finally visible!
Let's act for a quieter life
120dB
Pain threshold for sound intensity. However, the ear suffers damage starting at 85dB.
5 million
French people suffer from hearing problems, including 2 million under the age of 55. AFSSE
16 hours It takes more than 16 hours of rest for our ears to recover from 2 hours spent in a nightclub with noise at 105 dB.
Reducing noise pollution,
but why?
Noise is generally considered a disturbance, a nuisance, or an environmental pollution, but it also poses a health risk. Indeed, noise is the second most damaging environmental factor in Europe, after air pollution.
Even though the effects can vary greatly from one individual to another for the same level of noise exposure, this accumulation of high-intensity noise can lead to the development of chronic diseases and sleep disorders. Noise is ubiquitous in daily life: roads, airplanes, railways, transportation, industry, and even workspaces. It has real effects on health, well-being, and productivity.
With increasingly strict compliance requirements, noise monitoring plays a crucial role in many sectors: transportation, infrastructure, buildings, and urban construction.
Transform environmental data into actions:
Understand the impact of noise pollution to anticipate and promote healthier decisions.

Types of noise measured
- Ld (for Level day) corresponds to the average noise level during the period from 6 AM to 6 PM
- Le (for Level evening) corresponds to the average noise level during the period from 6 PM to 10 PM
- Ln (for Level night) corresponds to the average noise level during the period from 10 PM to 6 AM
- Lden (Level Day Evening Night) corresponds to the average noise level over a 24-hour period, with penalties for the evening and night
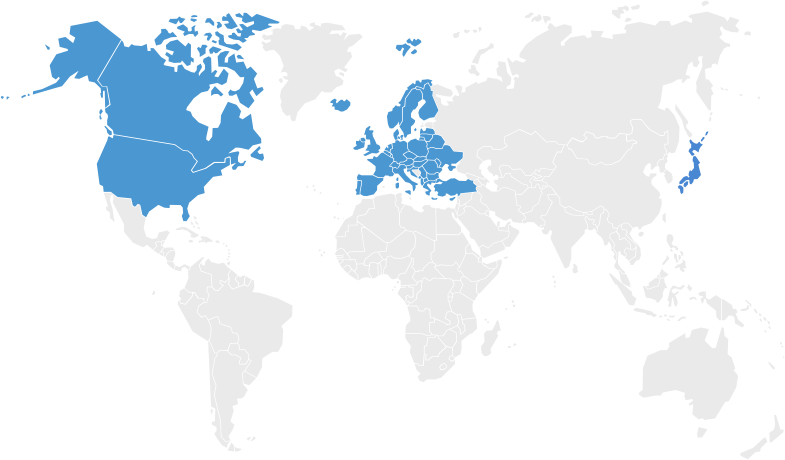
Coverage
Worldwide coverage – citywide
Parametric simulation
Parametric simulation allows you to adjust and test different parameters in order to model the impacts of noise pollution under various conditions. With this approach, you can simulate specific scenarios based on sound sources, geography, infrastructure and local environmental data.
Available parameters
- Street / building level (geographical resolution)
- Average noise level (period of a given day)
- Road noise
- Aircraft noise
- Railway noise
Customized to your needs
Tailor our noise monitoring and analysis solutions to your specific needs: select the relevant indicators, define the areas to be monitored and receive customized reports for targeted, effective action.
Noise modeling is carried out using a combined emission model and a propagation model. The techniques used by Meersens are derived from a research context conducted by renowned organizations and institutions. The methodology is now recognized by the European Commission and regulated by the directive on environmental noise. To establish a noise map for an urban area, the target location is divided into a grid of emitters (noise producers) and receivers (points where the noise level will be calculated). Noise maps are then produced by taking into account all the specific characteristics of the terrain (topography, buildings, roads, etc.) and considering the sound reality of an urban area.
87%
Average accuracy of the noise model.
Constantly calculated and verified against noise sensors deployed by Meersens in the modeled areas.
20min
Time required to generate a noise map.
20 minutes for a medium-sized city (≈70km², 300K inhabitants). This gives you an overview of Meersens’ capabilities in terms of
Strategic noise maps
Intended for cities and urban planning projects
Since 2002, France has mandated the creation of strategic noise maps to better assess and manage noise disturbances, in accordance with the European directive (2002/49/EC).

These maps are essential for protecting our sound environment and concern:
- Roads with more than 3 million vehicles per year,
- Railways with more than 30,000 train passages annually,
- Major airports with more than 50,000 aircraft movements each year,
- Urban areas of more than 100,000 inhabitants.
Construction site noise maps
Intended for stakeholders in the construction sector, integrators, and infrastructure managers
This solution offers a comprehensive approach to acoustic management of construction sites at all stages of the project.

- Generation and simulation of the initial noise map (state 0): Before the start of the work, a predictive sound simulation is carried out to establish a clear understanding of the sound situation in the surrounding area.
- Generation of noise maps for each construction phase: These maps are generated at each stage of the construction site, allowing for the anticipation and management of noise disturbances while complying with regulations.
Sensors
Monitor indoor noise pollution.
Is indoor noise your main concern? Discover our range of environmental sensors that are easy to install and use. Put an end to noise disturbances in your building.

A question, a project?
Customizable information for every business sector

🚧 Construction
Generation of noise maps.
Construction companies seek to limit noise disturbances generated by their activities and aim to assess and minimize the impacts of their sites on surrounding areas. By integrating a noise monitoring solution, they can obtain real-time data on noise levels in each work zone and generate accurate noise maps.
With this visualization, companies can identify and anticipate areas at risk of noise disturbance while strictly adhering to current regulations.

💼 Companies
Enhancing productivity and well-being in the workplace.
In order to improve employee comfort in an open office, companies face a challenge: ambient noise disrupts concentration and decreases productivity.
By using strategically placed noise sensors in the workspace, the company can monitor noise levels in real-time. This data can be analyzed to identify the noisiest areas and the times of day when noise levels are highest. Based on this information, the company can reconfigure the layout of the space, install soundproofing materials, or implement noise management policies to create a quieter environment conducive to concentration.

🏙️ Smart Cities
Ensuring public health and well-being.
Local authorities are constantly seeking ways to improve the quality of life for their residents, and effective management of urban noise is a crucial aspect. By using noise data, cities can identify and mitigate disruptive noise sources, thereby enhancing the quality of life in residential neighborhoods, commercial areas, and public spaces.
Noise monitoring thus becomes an essential strategic tool integrated into urban planning, demonstrating commitment and enhancing the attractiveness and reputation of the city as a place conducive to everyone’s flourishing.
Explore our data catalog
The Meersens API platform manages over 150 pollutants and parameters, providing you with new ways to achieve your goals and enhance your operations.
Explorer les données sur la qualité de l'air >
Explorer les données de pollen >
Explorer les données de pollution sonore >
Explorer les données sur la qualité de l'eau du robinet >
Explorer les données d'UV >
Explorer les données de météo >
• Particulate matter PM2.5
• Particulate matter PM10
• Ozone O3
• Sulphur dioxide SO2
• Carbon monoxide CO

• Grasses
• Weeds
• Grasses
• Weeds
• Levening: average evening noise between 6 PM and 10 PM
• Lnight: average night noise between 10 PM and 6 AM
• LDEN: average daily noise
• Railway noise
• Aerial noise
• Chemical
• Microbiological
• Global Horizontal Irradiance
• Relative humidity
• Atmospheric pressure
• Wind speed & direction
• Precipitation
• Cloud cover
News on noise pollution

Webinaire : environnement et santé mentale
Environnement et santé mentale : comprendre pour agir La santé mentale est aujourd’hui au cœur des enjeux de santé publique. Stress, anxiété, fatigue mentale ou troubles du sommeil touchent une part croissante de la population. Pourtant, ces problématiques sont encore...

The MAQI: global air quality and health index for all
The MAQI: the first global air quality index taking into account the impact of environment and health.

Cancer prevention: the positive impact of environmental data
Cancer and Environment: The Positive Impact of Environmental Data to Reduce Cancer Incidence.
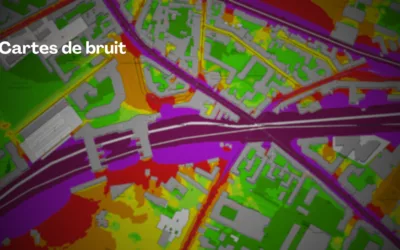
The noise maps in France
Noise maps: Mandatory every 5 years according to European regulations, they assess noise exposure from transportation and industries


